 |
Engineering & Environmental Geophysics Survey Services.
Geophysical consultants and contractors, InstrumentatioInstrumentation and monitoring, Vibration & noise. |
Electrical Resistivity Imaging Geophysical Surveys:-
Electrical resistivity imaging geophysical surveys (also known as resistivity tomography, ERI or ERT) measure the resistivity properties of the sub-surface by assessing the potential drops between electrodes in a variety of configurations, depending upon the type of geophysical survey data required.
Electrical resistivity surveys can be completed using a 4 electrode frame and the survey completed by walking the grid lines. The resulting data will give apparent electrical resisitivty data from a fixed depth range governed by the electrode spacing, usually 0.25 to 1m.
| Requirements
for deeper resistivity surveys to provide engineering and environmental geophysics data can
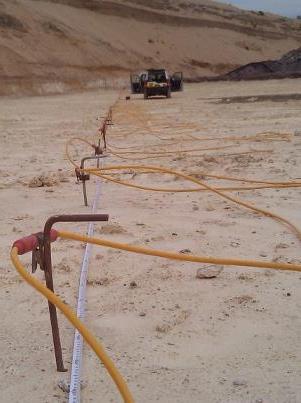
often benefit from making use of the latest development in resistivity surveying. Electrical Resistivity Imaging or Tomography surveys use an array of electrodes to measure apparent ground resistivity. The system uses a set of up to 256 electrodes under computer control to develop a pseudo-section using combinations of electrode readings. The photograph shows the resistivity imaging system in the field. The control unit is located in the vehicle in the distance. |
 |
The electrical resistivity tomography survey data are split into levels representing depth intervals and powerful modelling software is used to convert the data into calculated apparent resistivity depth sections. Depths of study up to 30m are not uncommon and on occasion 100m. This is a very powerful means by which to image the sub-surface over large sites for engineering or environmental projects.
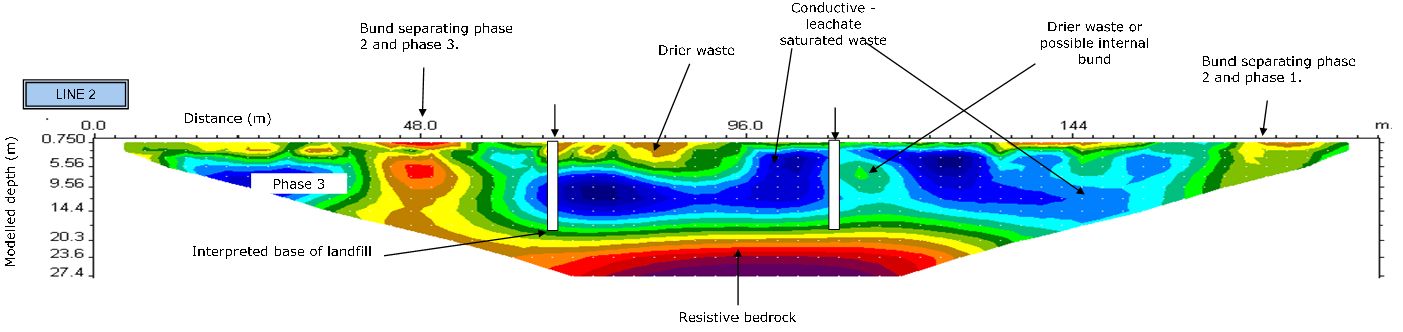
Below is an electrical resistivity imaging survey section collected to determine the internal situation within a closed landfill site. Note the low resistivity wastes (blue) over higher resitivity (reds) bedrock. Internal structures such as cell bunds and areas of drier waste are also visible.
 |
Applications :-
- Locate mineshafts, pipelines, foundations, voids.
- Landfill formation level surveys for voids, faults and solution cavities
- Soil electrical resistivity / earth testing for wind farm projects.
- Depth to rockhead, bedrock overburden, water table, peat thickness.
- Locate pollution plumes, buried waste.
- Identify solution features
- Locate historic or unmapped landfill / quarry site extents.
- Pipeline / road route surveys.
- Archaeology.
Benefits :-
- Output to client as sections and/or plans
- Wide depth range
- Easily correlated with borehole data
- Ideal for covering large sites where a number of vertical profiles assist interpretation.